HealthXchange will NEVER ask you to transfer money over a call. If in doubt, call the 24/7 ScamShield helpline at 1799, or visit the ScamShield website at www.scamshield.gov.sg.
Our heart is an important organ that functions through a complicated electrical system, where there are signals telling the heart when to contract and relax. This electrical activity is related to the impulses that travel through the heart to determine the heart rate and rhythm. Sometimes, the electrical activity can become unstable, and that is when a doctor may recommend performing an electrocardiogram (ECG) to try to find out the underlying issues.
By
Dr Teo Hooi Khee, Associate Consultant, Department of Cardiology
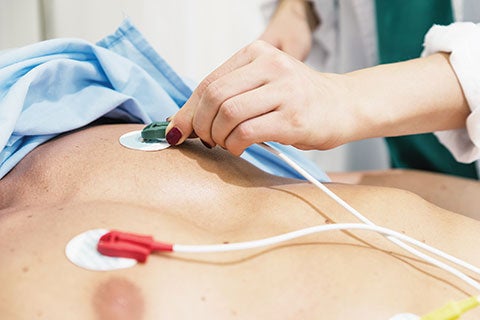
An ECG is a quick and easily accessible test used to detect and diagnose certain heart conditions. The standard ECG has 12 leads, with each lead representing the different electrical activity of the heart. It involves placing 10 small plastic stickers (electrodes) on the chest, arms and legs. These electrodes are then connected to an electrocardiographic machine which generates a visual tracing in the form of waves that can be displayed on a graph or monitor, reflecting the electrical activity of our heart. The test is painless, non-invasive and has no radiation exposure.
What is it used for?
The ECG is a simple investigation that helps detect any irregular heart rhythm or abnormal readings. It may be performed when one complains of breathlessness, chest pain, palpitations (sensation of heart pounding), giddiness or fainting spells. It aids in the diagnosis of heart conditions such as:
Myocardial Infarction (heart attack)
Ischaemia (poor blood flow to the heart beating)
Supraventricular tachycardia (heart beats very fast at over 100 beats a minute)
Arrhythmias abnormal heart rhythms) like:
Atrial Fibrillation rapid and irregular)
Complete heart block
Other inherited abnormal electrical abnormalities
The ECG can be done at rest or during an exercise. An exercise ECG may often be used together with other diagnostic tools like stress echocardiography (uses ultrasound imaging) and myocardial perfusion imaging (use of gamma camera) to aid in the diagnosis of certain heart conditions like coronary artery disease. This gives the doctor an idea of how the heart responds under stress.
There are also portable ECG devices such as 24-hour Holter monitoring and event recorder ECGs that can monitor and record abnormal heart rhythms continuously over a period of time. With the increasing use of wearable smart devices with the combination of health applications, single-lead ECG readings can now be conveniently taken and recorded. Such reading of ECG usually takes around 30 seconds to complete, and data collected will be sent to the paired health applications for viewing. However, do note that singlelead recordings may be insufficient for accurate diagnosis of complex arrhythmias and cardiovascular conditions. Consider seeking professional medical advice for a proper assessment and a clinical ECG.
Sample of an ECG recorded from a wearable device, showing normal heart rhythm (sinus rhythm).
Sample of an ECG recorded from a wearable device, showing adnormal heart rhythm - premature atrial beats (atrial ectopic).
FOR PHYSICIANS: TIPS ON ECG INTERPRETATIONS
An ECG lead is calculated by analysing several electrodes. The 12 lead ECG reflects a summation of vectors of the heart’s electrical activity over a 10-second period. ECG interpretation may seem daunting at first, but it provides a wealth of useful information for the clinicians in the assessment of cardiac patients. A systematic approach to interpreting ECGs is often helpful.
Step 1: Check that ECG is done accurately
A small proportion (about 0.4 to 4 percent) of all ECGs have had inaccurate lead placement, and the most common1 is the limb lead reversal of the right and left arm cables. Correct placement is crucial as any ECG abnormalities may simulate new ischaemic changes, conduction disturbances or even miss true myocardial ischaemia.
The normal cardiac axis lies between -30° and +90°. Cardiac depolarisation begins in the sinus atrial node, down the His-Purkinje system and finally through the right and left bundle branches. There is a net leftward depolarisation as the left ventricle has a larger mass. A quick and easy way to pick up limb lead reversal is to look at the axis of the QRS complexes in aVR (augmented vector right - right wrist) and aVL (augmented vector left - left wrist) and for the presence of unexpected inverted P waves in the rest of the limb leads.
TIPS! If a limb lead has a particularly low amplitude, an incorrect placement of right lower limb lead may be suspected.
Peripheral leads of an ECG with both arms and corresponding legs reversed (top) vs correct lead connections (bottom).
TIPS! In dextrocardia, the ECG often shows positive aVR, negative aVL and a positive R wave in aVR or an isoelectric line V1.
An ECG reading of dextrocardia (rare congenital disorder).
Step 2: Check the heart rate and rhythm
Lead II, the rhythm strip, gives a quick snapshot of the underlying rhythm and the rate.
The heart rate can be calculated by two methods:br/>
a) Counting the number of squares between two consecutive QRS complexes
b) Multiplying the number of QRS complexes in the rhythm strip by six
If the rhythm appears to be abnormal, a long rhythm strip can be generated by the ECG machine as well.
TIPS! Sometimes, it is difficult to distinguish between non-sustained atrial tachycardia and atrial fibrillation. A good way to look for P waves is in V1 which overlies the right atrium, or the limb leads.
An ECG reading of atrial flutter.
Step 3: Check for any abnormalities in the P waves, QRS and T wave complexes
a) P waves can be an indication of atrial enlargement, in the form of P mitrale and P pulmonale.
b) QRS complexes can be evaluated for right or left bundle branch blocks or abnormal Q waves in the precordial leads
c) Are the T waves of a normal height? Or are they tall and tented? Are there new T wave inversions?
d) Is there QTc prolongation?
Step 4: Check the relationship between the P wave and the QRS complexes
Is there a constant relationship between the P wave and the QRS complexes? An atrioventricular (AV) block represents a delay or disturbance in the transmission of an impulse from the atria to the ventricles. In general, there are first degree atrioventricular (AV) block, second degree AV block (Mobitz Type 1 or Mobitz Type 2), and third degree AV block (complete heart block).
Step 5:Check for any abnormalities of the ST segment
Is there ST – elevation? And is the ST elevation widespread or localised in certain areas?
TIPS! In patients with typical features of angina (chest pain), repeat the ECG in 15-min intervals and watch closely for worsening ST segment elevation or new T waves changes especially in equivocal ECGs. Remember to always correlate the ECG to the patient’s symptoms.
An ECG reading of Anterolateral ST – elevation myocardial infarction.
1Batchvarov VN, Malik M and Camm AJ. Incorrect electrode cable connection during electrocardiographic recording. Europace (2007) 9, 1081 – 1090.
This article is from Murmurs Issue 39 (January – April 2021). Click
here to read the full issue.